- FX Rocket Profits' Newsletter
- Posts
- Trading Edge: Fed Signals, Support Tests & Resistance Challenges
Trading Edge: Fed Signals, Support Tests & Resistance Challenges
FX Rocket Profits
December 09, 2025

Policy Endgames & Technical Inflection Points
This edition highlights the interplay between macro policy decisions and critical technical levels. The Trading Week Ahead outlook frames the Federal Reserve’s last move of the year, a decision that could set the tone for early 2026. On the technical side, AUD/CAD’s uptrend support near 0.9200 offers traders a chance to gauge whether momentum will hold or falter. Meanwhile, USD/JPY’s test of a long‑term ceiling underscores how major resistance levels can define trend continuation or reversal. Together, these perspectives remind us that trading success lies in balancing anticipation of policy shifts with tactical execution at key chart junctures.

⚡Trading Week Ahead: Fed’s Last Move of the Year
Macro Spotlight: Explore the Fed’s final policy decision of 2025 and its potential impact on markets.
Strategic Outlook: Gain insights into how traders can position themselves ahead of year‑end volatility.
🔥AUD/CAD Uptrend Support Near 0.9200
Technical Focus: Examine AUD/CAD as it tests uptrend support, a key level for continuation or breakdown.
Trade Scenarios: Identify possible setups around this support zone.
📊USD/JPY Testing Long‑Term Ceiling
Technical Spotlight: Analyze USD/JPY as it challenges a long‑term resistance level.
Strategic Insight: Consider breakout or rejection scenarios that could shape near‑term opportunities.

This curated set of articles blends macroeconomic foresight with actionable technical setups. Whether you’re anticipating the Fed’s final move, watching AUD/CAD’s support test, or tracking USD/JPY’s ceiling challenge, these reads provide a well‑rounded toolkit for navigating the week ahead. Use them to refine your strategy, balance fundamentals with technicals, and trade with confidence.
Happy Trading!

Wall Street Isn’t Warning You, But This Chart Might
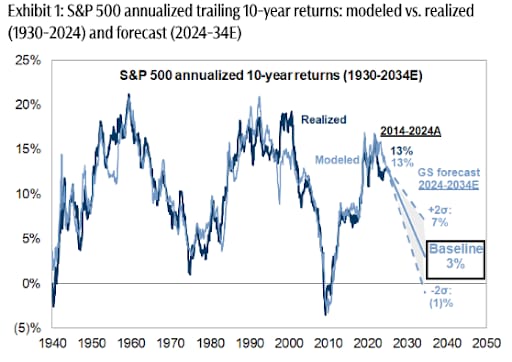
Vanguard just projected public markets may return only 5% annually over the next decade. In a 2024 report, Goldman Sachs forecasted the S&P 500 may return just 3% annually for the same time frame—stats that put current valuations in the 7th percentile of history.
Translation? The gains we’ve seen over the past few years might not continue for quite a while.
Meanwhile, another asset class—almost entirely uncorrelated to the S&P 500 historically—has overall outpaced it for decades (1995-2024), according to Masterworks data.
Masterworks lets everyday investors invest in shares of multimillion-dollar artworks by legends like Banksy, Basquiat, and Picasso.
And they’re not just buying. They’re exiting—with net annualized returns like 17.6%, 17.8%, and 21.5% among their 23 sales.*
Wall Street won’t talk about this. But the wealthy already are. Shares in new offerings can sell quickly but…
*Past performance is not indicative of future returns. Important Reg A disclosures: masterworks.com/cd.